

How to describe your business as an equation
And why you don’t fully understand your business until you can


👋 Hey, Lenny here! Welcome to this month’s ✨ free edition ✨ of Lenny’s Newsletter. Each week I tackle reader questions about building product, driving growth, and accelerating your career.
If you’re not a subscriber, here’s what you missed this month:
Subscribe to get access to these posts, and every post.
Every business can be distilled into a simple equation.
And until you can express your business as one, you don’t fully understand it.
Figuring out this equation forces you to think about the inputs that drive your business, the outputs you want to prioritize, and how these variables interact. It also gives you a map for understanding which metrics you need to track, what factors drive the growth of your business, and, most importantly, where you have the most leverage to drive an outsize amount of impact (and thus where to assign your precious people and resources).
To help you flesh out your own business equation, Dan Hockenmaier and I put together example equations for the most common tech business models:
B2B SaaS
Bottom-up B2B SaaS with seat-based pricing
Bottom-up B2B SaaS with usage-based pricing
Top-down B2B SaaS
B2C/consumer
B2C subscription (trial or freemium)
B2C free (ads)
Marketplaces
B2C marketplaces
B2B marketplaces
DTC/e-commerce
First, a few disclaimers:
This won’t be easy. These equations and concepts can be some of the most divisive within your company, particularly between your product, GTM, finance, and sales teams. But once the equations are defined, your teams are aligned, and the equations operationalized, you’ll experience a huge force multiplier—because everyone will be focusing their energy on the same (high-leverage) levers.
This won’t be perfect. While we lay out the different “recipes,” every business is unique. Thus, the equations will require some adapting to match your business. Please send us feedback (or leave a comment below) on anything you think we’re missing, or anything unique about your business that caused you to modify the equation you use. We’d love to hear it.
We focused on ARR and revenue. All of these equations output revenue or ARR. If your business has high gross margins (e.g. >80%-90%), like some SaaS businesses, you may be able to stop there. But for any business with meaningful cost of sales, such as DTC and most marketplaces, you’ll want to instead output a metric like contribution margin. For these cases, see the section at the end of the post on adding margin to your equation.
Business equations don’t cover every important metric. One key metric for every business is customer acquisition payback period. This is related to but not directly captured in the equations below. See the section at the end on how to calculate your payback period.
How to make the most of this post
Create your own business’s math formula, with inspiration from a formula below
Have a discussion with your team about how your business grows through the lens of this formula
Identify the highest-leverage lever(s) within your formula, and put more resources behind it
Identify one new lever you haven’t invested in, and experiment with it
Turn the formula into a full-fledged growth model (something we’ll explore in a future post)
A huge thank-you to Abi Noda (DX), Alex Bilmes (Endgame), Alexa Grabell (Pocus), Barry McCardel (Hex), Boris Jabes (Census), Christina Cacioppo (Vanta), Colin Dunn (Visual Electric), Dom Wong (Pogo), Emily Kramer (MKT1), Jeremy Cai (Italic), May Habib and James Lee (Writer), Merci Victoria Grace (Panobi), Nels Gilbreth, Peter Kazanjy (Atrium), Reed McGinley-Stempel (Stytch), Rujul Zaparde (Zip), Whitney Steele (Descript), William Hicks (Magic Mind), and Zach Grannis for sharing feedback and advice on this post 🙏
Also, don’t miss Dan Hockenmaier’s newsletter, which is a must-read for anyone working on growth and marketplaces.
B2B SaaS equations
A B2B SaaS business sells cloud-hosted software on a subscription basis (that’s what makes it software as a service—SaaS) to other businesses (that’s what makes it B2B). Examples include Snowflake, Slack, and Jira.
B2B SaaS businesses typically monetize in one of two ways—per seat (e.g. Slack) or by usage (e.g. Datadog)—and grow in one of two ways—through a bottom-up motion (i.e. individual employees within a company discover the product on their own, as with Figma and Notion) or a top-down motion (i.e. salespeople sell the product into company leaders, as with Salesforce and Box). And though not exactly the same thing, a bottom-up growth motion is, in practice, essentially the same as a “product-led growth” (PLG) motion.
Below, we’ll look at the three most common B2B SaaS business models, sharing both a simplified version of each business equation (as an image) and the full equation in the text under it.
1. Bottom-up B2B SaaS with seat-based pricing
Examples: Figma, Slack, Zoom, Adobe Creative Cloud, Asana, Jira.

ARR = New ARR + Expansion ARR + Reactivation ARR – Churned ARR – Contraction ARR
New ARR = New seats * price per seat
New seats = Visitors * conversion to trial/freemium * conversion to paid * seats per account
Visitors
Paid ads
SEO
Direct (e.g. word of mouth, virality)
Referral (e.g. G2, social, articles)
Conversion to trial/freemium
Visit to CTA
CTA to signup
Signup to activation
Conversion to paid
Awareness of paid plan
Starting the purchase process to completing the purchase process
Value of product
Lead nurturing
Expansion ARR = Accounts upsold * average price increase
Accounts upsold
In-product upsells
Outbound
Hitting limits
Average price increase
Seat growth
Headcount growth
Internal virality
Colleague invite rate
Invite conversion rate
Cross-sold products (e.g. Figma -> FigJam)
Hitting more expensive tiers
Raising prices
Reactivation ARR
Reactivated logos
Reactivated seats
Churned ARR
Churned logos
Contraction ARR
Seat contraction
Downgrading tiers
Stopped using additional products
2. Bottom-up B2B SaaS with usage-based pricing
Examples: AWS, Datadog, Twilio

ARR = New ARR + Expansion ARR + Reactivation ARR – Churned ARR – Contraction ARR
New ARR = New usage * price for usage
New usage = Visitors * conversion to trial/freemium * conversion to paid
Visitors
Paid ads
SEO
Direct (e.g. WOM, virality)
Referral (e.g. G2)
Conversion to trial/freemium
Visit to CTA
CTA to signup
Signup to activation
Conversion to paid
Awareness of paid plan
Starting the purchase process to completing the purchase process
Value of product
Inbound sales/account managers nurturing leads
Price for usage
Expansion ARR = Accounts upsold * average price increase
Accounts upsold
In-product upsells
Outbound
Hitting limits
Average price increase
Usage growth
Headcount growth
Internal virality
Colleague invite rate
Invite conversion rate
Data/customer/use-cases growth
Cross-sold products (e.g. Figma -> FigJam)
Hitting more expensive tiers
Raising prices
Reactivation ARR
Reactivated logos
Reactivated users
Churned ARR
Churned logos
Contraction ARR
Reduced usage
Downgrading tiers
Stopped using additional products
3. Top-down (sales-led) B2B SaaS
Examples: Snowflake, Box, Salesforce, Workday, Looker
This category includes both seat-based and usage-based pricing and normally ends up as a predetermined negotiated annual contract.
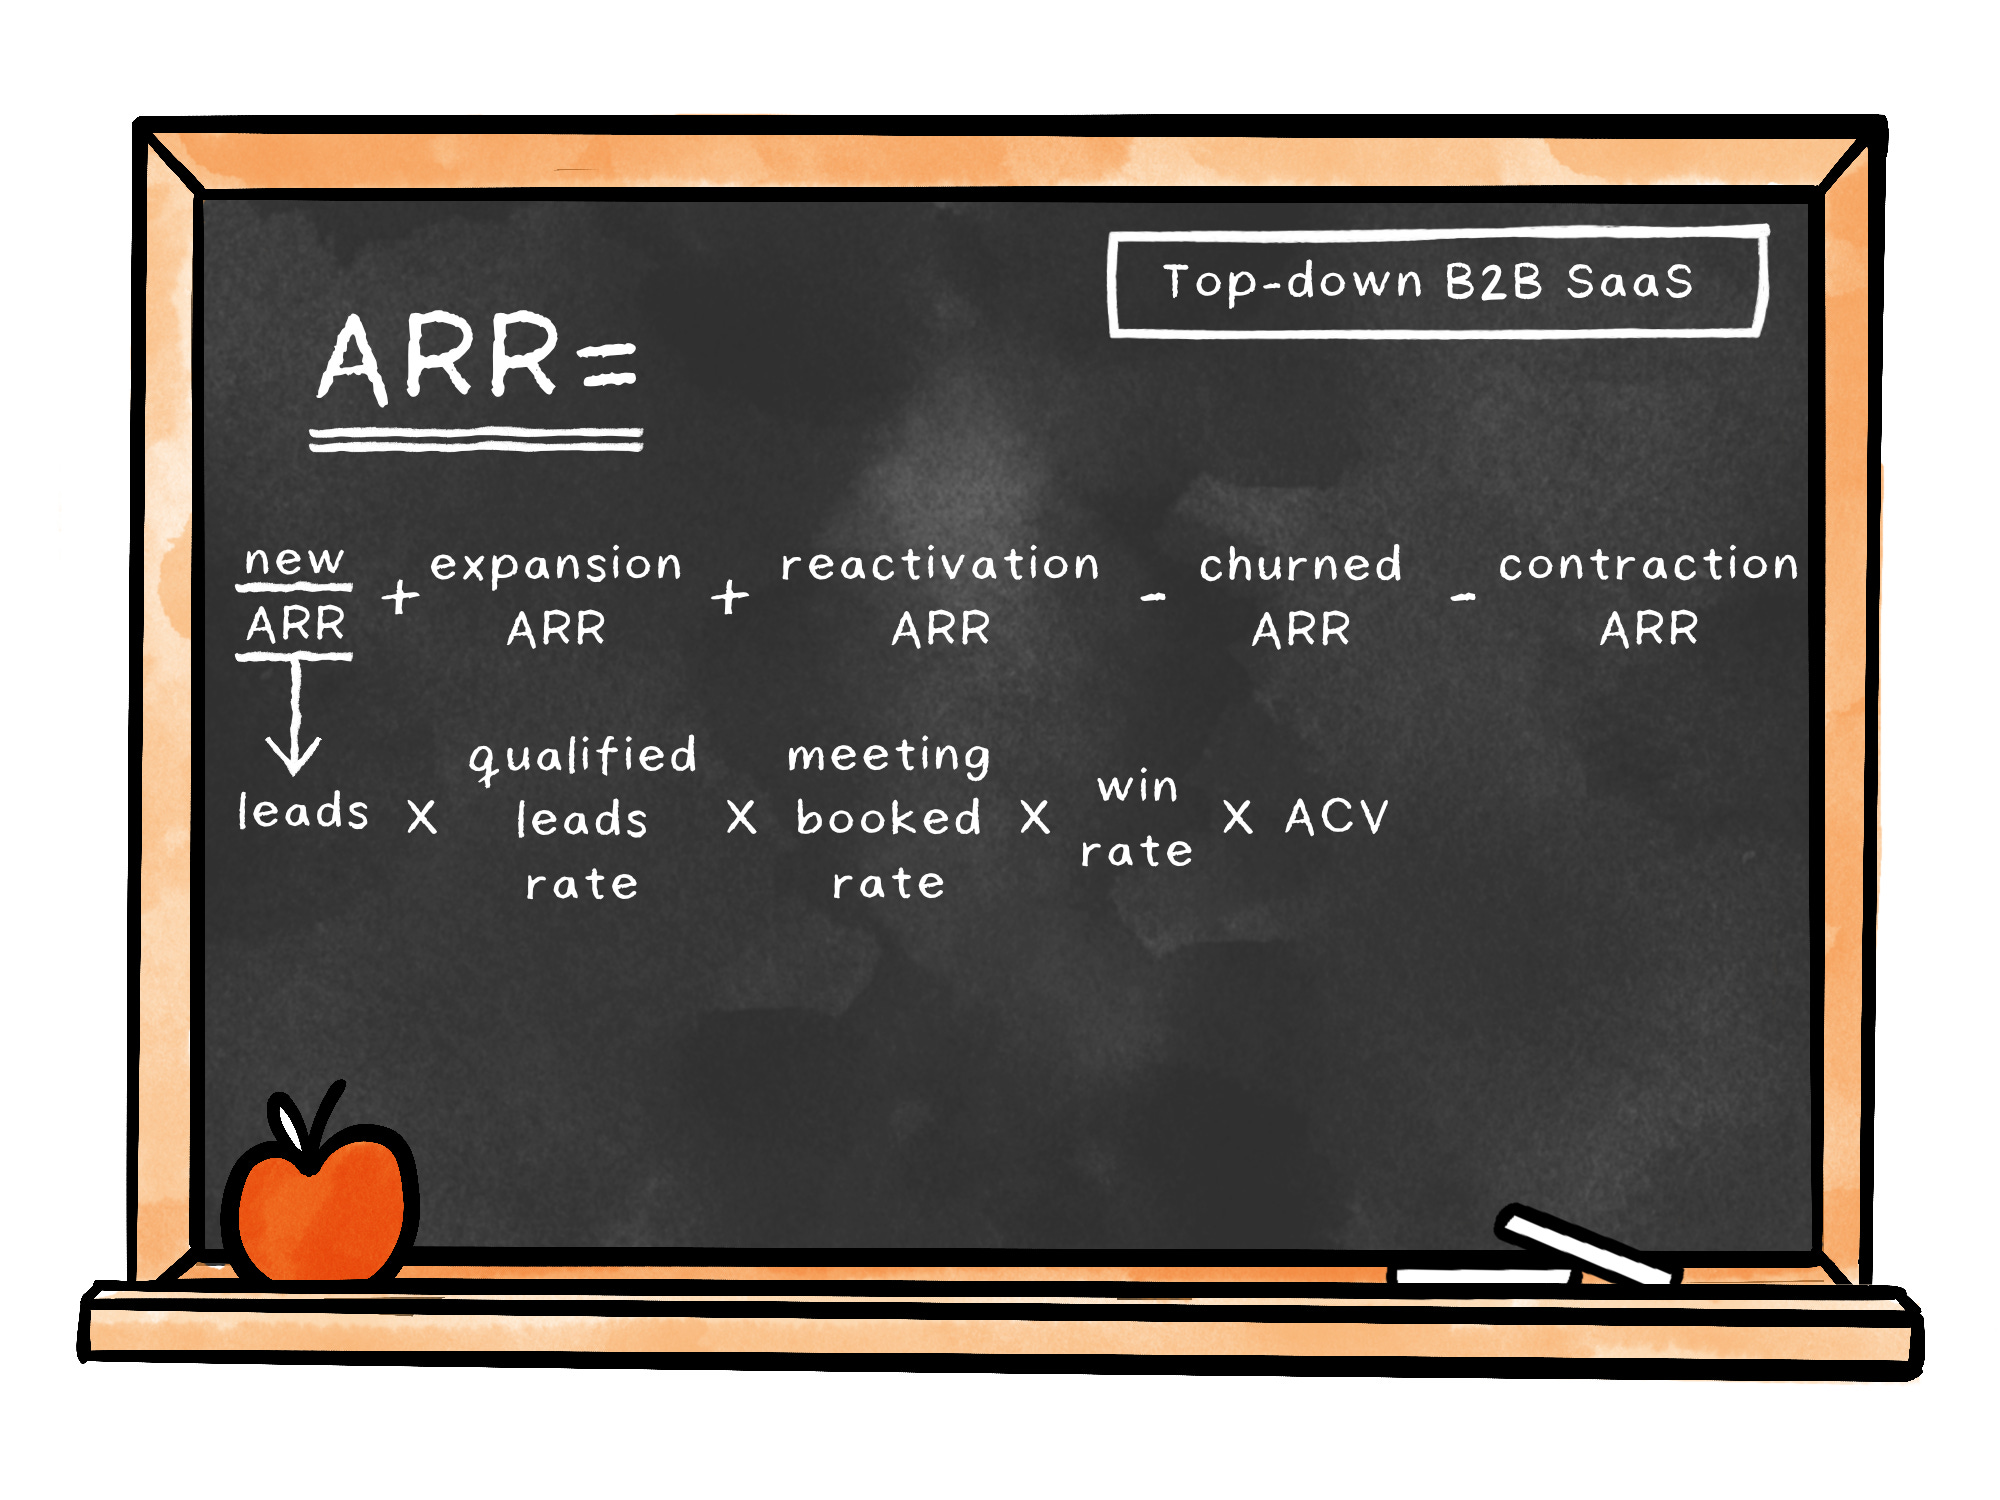
ARR = New ARR + Expansion ARR + Reactivation ARR – Churned ARR – Contraction ARR
New ARR = Leads * qualified leads rate * meeting booked rate * win rate * ACV
Leads = Direct + indirect
Direct = Outbound + inbound
Outbound
Cold emails
Cold calls
Cold DMs
Events
Inbound
Paid ads
SEO
Referrals (e.g. G2, backlink, social mentions)
Direct (e.g. signs up for demo on website)
Indirect
Channel partnerships
Number of partnerships
Leads per partner
Conversion rate
Expansion ARR = Accounts upsold * average price increase
Accounts upsold
In-product upsells
Sales nurturing
Hitting limits
Average price increase
Seat/usage growth
Headcount growth
Internal virality
Colleague invite rate
Invite conversion rate
Data/customer/use-cases growth
Cross-sold products (e.g. Figma -> FigJam)
Hitting more expensive tiers
Raising prices
Reactivation ARR
Reactivated logos
Reactivated users
Churned ARR
Churned logos
Contraction ARR
Reduced seats/usage
Downgrading tiers
Stopped using additional products
B2C/consumer equations
Consumer businesses make a software product for individual consumers. Examples include Netflix, TikTok, and Google.
Consumer products typically monetize in one of two ways—subscriptions (e.g. Duolingo, Spotify, Tinder) and ads (e.g. Instagram, Snap, YouTube). Below, we’ll look at these two models.
4. B2C with subscription-based pricing (trial or freemium)
Examples: Duolingo, Spotify, Tinder, Calm, Strava, MyFitnessPal

ARR = MRR x 12 = (New subs + Retained subs + Reactivated subs) * Average monthly revenue per sub * 12
New subs = Traffic * visit to trial/freemium conversion * trial to paid conversion
Traffic
Paid ads
SEO
Direct/WOM
Referrals (i.e. invites)
Visit to trial/freemium conversion
Visit to onboarding
Onboarding to activation
Trial to paid conversion
Awareness of paid plan
Starting to purchase to completing purchase
Retained subs
Reactivated subs
Average monthly revenue per sub
% annual vs. monthly subs
% premium vs. basic subs
5. B2C with ads (i.e. free for the user)
Examples: Instagram, Google, TikTok, Meta, Snap, Twitter

Revenue = Active users * Impressions per user * CPM/CPC/CPA
Active users = New users in period + retained users from prior periods
New users = Traffic * conversion
Traffic
Paid ads
SEO
Direct/WOM
Organic social
Referrals (i.e. invites)
Conversion
Visit to onboarding
Onboarding to activation
Retained users from prior period
Quality of product and experience
Re-engagement (upsell/cross-sell)
Impressions per user = Sessions * impressions per session * sessions per user
Sessions
Pulling user back
Impressions per session
Ad load
Sessions per user
CPM/CPC/CPA
User quality
Geo
Income
Profession
Conversion rate from click to purchase
Marketplace equations
A marketplace business facilitates transactions between buyers and sellers. Examples include Airbnb, DoorDash, Uber, eBay, and Faire.
These businesses don’t own the supply (e.g. the homes, the cars, the restaurants) but instead make it easy for customers to find and purchase from these sellers.
Marketplaces monetize primarily through a transaction fee and occasionally through a subscription fee.
There are two types of marketplaces—B2C marketplaces, which cater to individual consumer customers (e.g. Airbnb, Uber), and B2B marketplaces, which cater to business customers (e.g. Faire, Pachama).
6. B2C marketplaces
Examples: Airbnb, Uber, DoorDash, Etsy, eBay

Revenue = Transactions * AOV * Take rate
Transactions = (New traffic + returning customers) * conversion to purchase
New traffic
Paid ads
SEO
Direct/WOM
Referrals (i.e. invites)
Returning customers
Quality of product and experience
Re-engagement (upsell/cross-sell)
Conversion to purchase
Visit to search
Search to product page
Product page to start checkout
Start checkout to complete purchase
AOV
Take rate
Supply-side commission +
Demand-side commission +
Additional revenue per transaction
Subscriptions
Financing fees
7. B2B marketplaces
Examples: Faire, Amazon Business, Pachama, Novi

Revenue = Transactions * AOV * Take rate
Transactions = Active customers * transactions/customer
Active customers = New activated customers + retained customers
New activated customers = Signups * conversion from signup to activation
Signups
Inbound
Paid ads
SEO
Direct/WOM
Referrals (i.e. invites)
Outbound
Calls
Emails
DMs
Conversion from signup to activation
Visit to search
Search to product page
Product page to start checkout
Start checkout to complete purchase
Retained customers
Conversion of new to retained customers +
Resurrection of previously active customers –
Churned customers
Transactions/customer
Quality of product and experience
Re-engagement (upsell/cross-sell)
AOV
Take rate
Supply-side commission +
Demand-side commission +
Additional revenue per transaction
Subscriptions
Financing fees
8. DTC/e-commerce equation
Finally, we have direct-to-consumer (DTC) and e-commerce businesses, which sell a physical product to individuals. This includes companies like Warby Parker, Casper, Glossier, and Dollar Shave Club.

Revenue = Transactions * AOV
Transactions = Traffic * conversion rate
Traffic = New traffic + returning traffic
New traffic
Paid ads
SEO
Direct (e.g. WOM, virality)
Returning traffic
Quality of product and experience
Re-engagement (upsell/cross-sell)
Conversion rate
Visit to search
Search to product page
Product page to start checkout
Start checkout to complete purchase
AOV (average order value)
Adding margin to your business equation
For any business with sufficiently high cost of sales, you can’t stop at revenue. What you’re really optimizing for is contribution margin, or what is left over after you take out all variable costs of a transaction.
This is a key metric because it describes how much you have left over to reinvest in the business. It’s also how more margin-intensive businesses will typically ultimately be valued, as opposed to high-margin businesses, like SaaS, which are often valued on multiples of ARR.
To apply margin to the equations above, all you have to do is calculate your average contribution margin rate (CM%) and multiply it by revenue. So for a DTC business, the formula would be:
Contribution margin = Transactions * AOV * CM%
There are two big components of cost to consider. Deducting only the first would give you a gross margin, and including the second gets you to contribution margin.
Direct variable costs: These are costs that are directly driven by a transaction and are easy to attribute. For DTC models, this would include things like cost of goods sold, incentives, and shipping. For marketplace models, it would include things like payment processing fees, incentives, and defaults.
Indirect variable costs: These are costs that are not directly driven by transactions but tend to increase as transactions increase, and include things like marketing and customer support.
Calculating payback period
For every business model here, one of the most important metrics that is not directly covered in these equations is customer acquisition payback period, i.e. the amount of time it takes for you to recoup the costs of customer acquisition. This is a better measure than LTV/CAC because it tells you how quickly you can invest in driving more growth.
At the highest level, you can calculate payback period as CAC divided by annual contribution margin per customer. For example, if you have a CAC of $100 and an average annual contribution margin per customer of $120, your payback period would be 0.83 years, or 10 months.
For certain business models, especially marketplaces, this equation gets more complicated. See “problem #2” in this essay for an explanation of how to calculate payback periods for marketplaces. Also, here are handy benchmarks for good and great payback periods.
📚 Further study
Have a fulfilling and productive week 🙏
👀 Hiring? Or looking for a new job?
I’m piloting a white-glove recruiting service for product roles, working with a few select companies at a time. If you’re hiring for senior product roles, apply below.
If you’re exploring new opportunities yourself, use the same button above to sign up. We’ll send over personalized opportunities from hand-selected companies if we think there’s a fit. Nobody gets your info until you allow them to, and you can leave anytime.
If you’re finding this newsletter valuable, share it with a friend, and consider subscribing if you haven’t already. There are group discounts, gift options, and referral bonuses available.
Sincerely,
Lenny 👋
 | A guest post by
|